How Do I Profile eBPF Code?
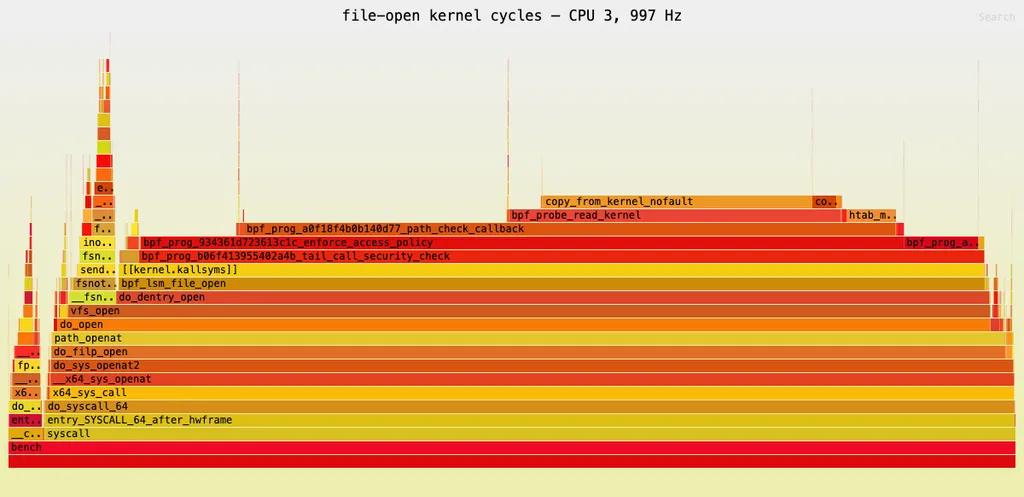
The article outlines a method for profiling eBPF code by measuring the performance impact of file open operations using a minimal C benchmark. It details the required kernel settings, symbol exposure steps, and the use of the perf tool with specific options to capture kernel‑mode cycles and call stacks. Finally, it provides commands for running the benchmark with CPU pinning and high priority to obtain reliable latency statistics.
- ▪A simple C test harness is provided to repeatedly open a file and record the time taken for each operation, discarding the first 10% of measurements as warm‑up.
- ▪Kernel sysctl settings are adjusted to enable BPF JIT compilation and expose JIT symbols so perf can resolve program names.
- ▪The perf command is configured to record CPU cycles in kernel mode, capture call graphs using frame pointers, and sample at a non‑round frequency to avoid periodic alignment.
- ▪Benchmark execution is pinned to a specific CPU core and given real‑time priority with taskset and chrt to minimize scheduling noise.
Hacker News (Front Page) files mainly under programming. We currently carry 705 of its stories. Top-voted stories on Hacker News.
Story provenance
Source · retrieval · rights · ranking — open for full record
inspect →
Attribution is not the same as permission. This drawer separates discovery metadata, excerpts, WeSearch-generated summaries, reuse status, and whether the publisher receives the visit. Nothing here claims a legal grant the publisher has not made.
Record
| Original publisher | naveen srinivasan |
| Canonical URL | https://naveensrinivasan.com/posts/2026-07-22-how-do-i-profile-ebpf-code/ |
| Publication time | Tue, 28 Jul 2026 15:55:44 +0000 |
| Retrieval time | 2026-07-28T16:15:32.640Z |
| Last seen | 2026-07-28T16:15:32.640Z |
| Headline source | Publisher (no WeSearch rewrite) |
| Excerpt source | publisher body |
| Excerpt method | First ~120 words (~800 chars) of extracted publisher body, fair-use limited. |
| Summary | WeSearch · cerebras-chat (WeSearch summarizer) |
| Summary source text | contentText |
| Citation coverage | Summary is a WeSearch-generated derivative; primary citation is the original publisher URL. |
| Cluster | iG60YpYLCWGq · 1 stories |
| Cluster logic | Grouped by semantic title/content similarity across sources within a rolling window. Same-publisher template collisions are excluded from coverage comparison. |
| Ranking reason | Story pages are not engagement-ranked. Hub feeds use recency, with optional source-diversified chronological ordering (cap consecutive stories per source). No personalized ranking. |
| Publisher visit | Yes — open original |
| Substitutes article? | No — link-out required for full text |
Rights status (four layers)
WeSearch handling by dimension
| Indexing | May the item be indexed (stored, ranked, made findable)? | Allowed |
| Snippet | May a short excerpt of the publisher's text be shown? | Allowed |
| AI summary | May WeSearch generate its own short summary of the article? | Limited |
| Retrieval / RAG | May the content be exposed for third-party retrieval-augmented generation? | Not asserted |
| Model training | May the content be used to train AI models? | Not asserted |
| Commercial reuse | May the content be reused commercially? | Not permitted |
Basis: Derived from the published RSS/Atom feed. Contact: [email protected]. Reviewed: 2026-07-24.
Opening excerpt (first ~120 words) tap to expand
How Do I Profile eBPF Code?If we are running any eBPF workload or writing eBPF code, we want to measure its performance impact, and in this post we will demonstrate an example of how to do it.In this example, our goal is to measure the performance of file open operations, one of the most critical functions in the OS. Our code used file open hooks in eBPF, we wanted to measure the performance overhead introduced by adding this hook.To identify likely bottlenecks, we need a simple C test harness with the fewest dependencies, designed to measure file open performance.#define _GNU_SOURCE #include <fcntl.h> #include <stdio.h> #include <time.h> #include <stdint.h> #include <stdlib.h> #include <unistd.h> #include <sched.h> #include <sys/mman.h> #include <sys/syscall.h> static inline uint64_t…
Excerpt limited to ~120 words for fair-use compliance. The full article is at naveen srinivasan.
Discussion
0 commentsMore from naveen srinivasan