Matplotlib vs Plotly: Which Python Chart Tool Should You Choose?
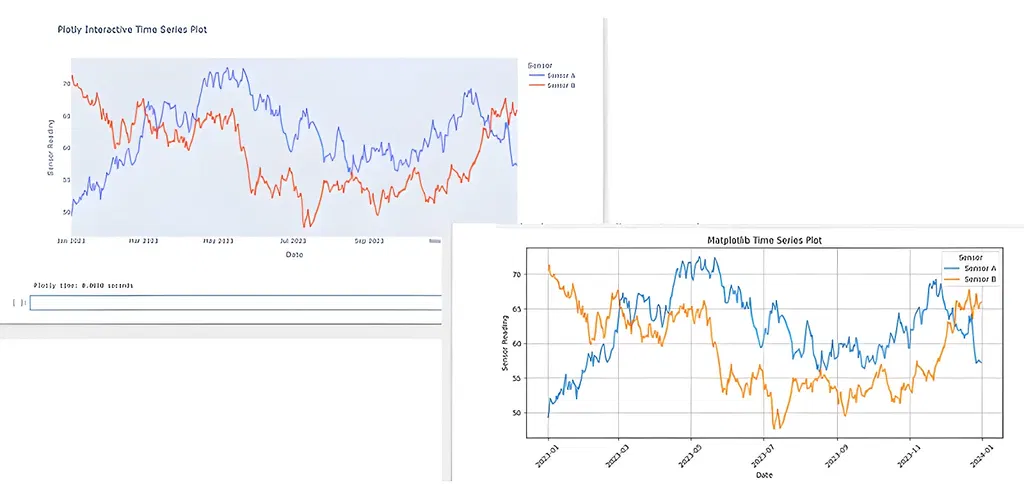
The article discusses the differences between Matplotlib and Plotly, two popular Python charting libraries. Matplotlib is a veteran library that provides static, publication-quality charts, while Plotly offers interactive visualizations. The article aims to help readers decide which library to use based on their specific needs.
- ▪Matplotlib is a widely used Python plotting library that provides static, publication-quality charts.
- ▪Plotly is a modern, open-source graphing library that creates interactive visualizations.
- ▪Plotly's interactivity allows users to explore data in more detail, including zooming, panning, and hovering over elements to see exact values.
Towards Data Science files mainly under ai. We currently carry 160 of its stories.
Story provenance
Source · retrieval · rights · ranking — open for full record
inspect →
Story provenance
Attribution is not the same as permission. This drawer separates discovery metadata, excerpts, WeSearch-generated summaries, reuse status, and whether the publisher receives the visit. Nothing here claims a legal grant the publisher has not made.
Record
| Original publisher | Towards Data Science |
| Canonical URL | https://towardsdatascience.com/matplotlib-vs-plotly-which-python-chart-tool-should-you-choose/ |
| Publication time | Fri, 07 Aug 2026 16:30:00 +0000 |
| Retrieval time | 2026-08-07T16:40:42.051Z |
| Last seen | 2026-08-07T16:40:42.051Z |
| Headline source | Publisher (no WeSearch rewrite) |
| Excerpt source | publisher body |
| Excerpt method | First ~120 words (~800 chars) of extracted publisher body, fair-use limited. |
| Summary | WeSearch · cerebras-chat (WeSearch summarizer) |
| Summary source text | contentText |
| Citation coverage | Summary is a WeSearch-generated derivative; primary citation is the original publisher URL. |
| Cluster | CAJXiPvEEUcz |
| Cluster logic | Grouped by semantic title/content similarity across sources within a rolling window. Same-publisher template collisions are excluded from coverage comparison. |
| Ranking reason | Story pages are not engagement-ranked. Hub feeds use recency, with optional source-diversified chronological ordering (cap consecutive stories per source). No personalized ranking. |
| Publisher visit | Yes — open original |
| Substitutes article? | No — link-out required for full text |
Rights status (four layers)
WeSearch handling by dimension
| Indexing | May the item be indexed (stored, ranked, made findable)? | Allowed |
| Snippet | May a short excerpt of the publisher's text be shown? | Allowed |
| AI summary | May WeSearch generate its own short summary of the article? | Limited |
| Retrieval / RAG | May the content be exposed for third-party retrieval-augmented generation? | Not asserted |
| Model training | May the content be used to train AI models? | Not asserted |
| Commercial reuse | May the content be reused commercially? | Not permitted |
Basis: Derived from the published RSS/Atom feed. Contact: [email protected]. Reviewed: 2026-07-24.
Opening excerpt (first ~120 words) tap to expand
Data Visualization Matplotlib vs Plotly: Which Python Chart Tool Should You Choose? From static plots to interactive data exploration Thomas Reid Aug 7, 2026 8 min read Share Image by Author If you are a data scientist or analyst, a significant part of your workload will be creating data visualisations, and if you are a Python user, you’re likely already familiar with or have a passing knowledge of Matplotlib. It’s a cornerstone of Python plotting. But, as is often the case, what if you want your audience (or yourself) to interact with your plots – zoom in on details, hover over points to see values, or toggle datasets on and off? For that, the Plotly charting library offers a compelling, modern alternative.
…
Excerpt limited to ~120 words for fair-use compliance. The full article is at Towards Data Science.
Discussion
0 commentsMore from Towards Data Science