
Show HN: The bottom 50% of U.S. households are short after essentials (BLS data)
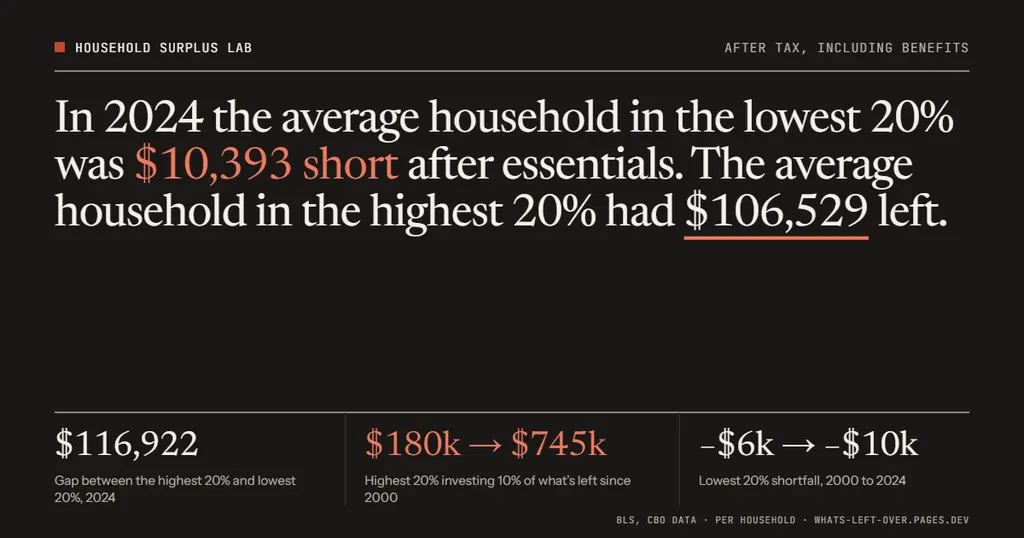
A new data visualization highlights that the bottom 50% of U.S. households often have little to no money left after covering essential costs. The analysis uses Bureau of Labor Statistics data to illustrate the significant gap in disposable income and accumulated wealth between different income quintiles. It further demonstrates how this initial disparity compounds over time, resulting in a massive difference in portfolio values and total household net worth.
- ▪The bottom 50% of U.S. households frequently have minimal or negative surplus after paying for essential living costs.
- ▪Data from the Federal Reserve shows that the top 0.1% of households hold a disproportionate share of total household wealth.
- ▪Simulations indicate that investing a portion of yearly surplus since 2000 has widened the gap in portfolio values between income groups.
- ▪The visualization distinguishes between yearly cash flow constraints and long-term asset accumulation trends.
Hacker News (Front Page) files mainly under programming. We currently carry 1,689 of its stories. Top-voted stories on Hacker News.
Story provenance
Source · retrieval · rights · ranking — open for full record
inspect →
Story provenance
Attribution is not the same as permission. This drawer separates discovery metadata, excerpts, WeSearch-generated summaries, reuse status, and whether the publisher receives the visit. Nothing here claims a legal grant the publisher has not made.
Record
| Original publisher | Household Surplus Lab |
| Canonical URL | https://whats-left-over.pages.dev/#s=50_40_10&c=1&u=person&t=0&tm=cbo&b=0&ts=100&k=0&cc=12201&im=nominal&by=2000&ir=2.5&ao=0&ar=20&at=200000&ip=10&rm=sp500&rr=8&pv=portfolio&p=1&iv=left&hp=1&e=food.housing.transport.health.insurance |
| Publication time | Tue, 15 Sep 2026 15:24:11 +0000 |
| Retrieval time | 2026-09-15T18:16:52.586Z |
| Last seen | 2026-09-15T18:16:52.586Z |
| Headline source | Publisher (no WeSearch rewrite) |
| Excerpt source | publisher body |
| Excerpt method | First ~120 words (~800 chars) of extracted publisher body, fair-use limited. |
| Summary | WeSearch · cerebras-chat (WeSearch summarizer) |
| Summary source text | contentText |
| Citation coverage | Summary is a WeSearch-generated derivative; primary citation is the original publisher URL. |
| Cluster | KMpjE19x89jo · 1 stories |
| Cluster logic | Grouped by semantic title/content similarity across sources within a rolling window. Same-publisher template collisions are excluded from coverage comparison. |
| Ranking reason | Story pages are not engagement-ranked. Hub feeds use recency, with optional source-diversified chronological ordering (cap consecutive stories per source). No personalized ranking. |
| Publisher visit | Yes — open original |
| Substitutes article? | No — link-out required for full text |
Rights status (four layers)
WeSearch handling by dimension
| Indexing | May the item be indexed (stored, ranked, made findable)? | Allowed |
| Snippet | May a short excerpt of the publisher's text be shown? | Allowed |
| AI summary | May WeSearch generate its own short summary of the article? | Limited |
| Retrieval / RAG | May the content be exposed for third-party retrieval-augmented generation? | Not asserted |
| Model training | May the content be used to train AI models? | Not asserted |
| Commercial reuse | May the content be reused commercially? | Not permitted |
Basis: Derived from the published RSS/Atom feed. Contact: [email protected]. Reviewed: 2026-07-24.
Opening excerpt (first ~120 words) tap to expand
Lowest group · left in 2024?—— Highest group · left in 2024?—— Top portfolio · 2024?—10% of positive surplus Portfolio gap?—Largest ÷ smallest portfolio An illustrative model, not tax or investment advice. Fig. 1Money left after essentials?Yearly pre-tax income excluding benefits, minus essential costs. Per person. Nominal $QuintilesPer personEstimated groups Show?Money left after essentialsIncomeHappiness plateau line? Show 2025–2026 projection? Show the numbers Fig. 2What investing it adds up to?Portfolio balance from investing part of each year’s surplus since 2000. S&P 50010% investedEstimated groups Show as?Portfolio valueContributions vs. growthReturn stacked on yearly surplusReturn stacked on yearly income Show the numbers Figs. 1–2 follow yearly cash flow. Fig.
…
Excerpt limited to ~120 words for fair-use compliance. The full article is at Household Surplus Lab.
Discussion
0 commentsMore from Household Surplus Lab