
Visualizing the Artemis II Mission
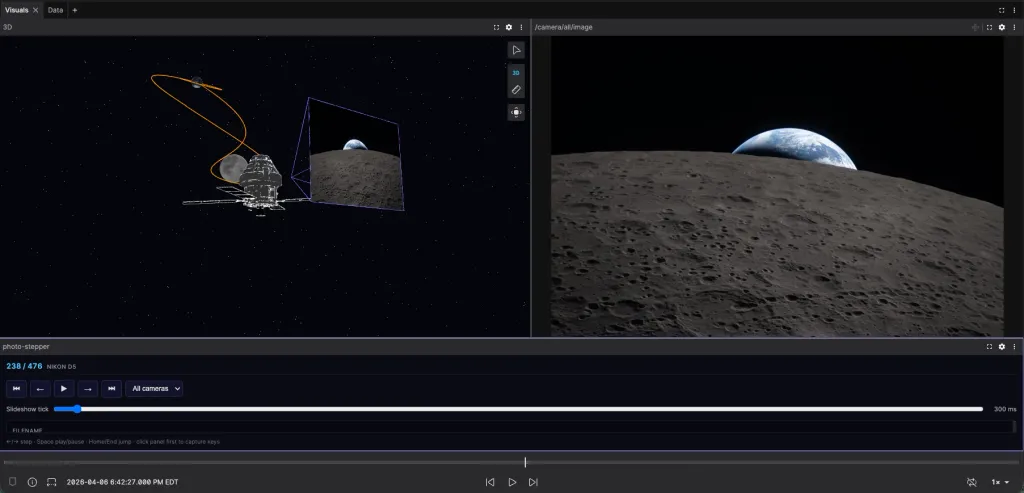
The article describes a project that visualizes the Artemis II mission using the Foxglove platform, integrating Orion’s trajectory and mission photos into a synchronized timeline. Data were sourced from the JPL Horizons API for the spacecraft’s path and from Hank Green’s Artemis‑Timeline repository for the images. Custom extensions, including a photo‑stepper panel, were built to allow interactive exploration of the mission’s ten‑day duration.
- ▪The trajectory data was obtained from the JPL Horizons API, which provides precise ephemeris for solar‑system objects.
- ▪Hank Green’s Artemis‑Timeline project supplied timestamps, camera details, and high‑resolution photos for the mission.
- ▪The 3D scene employed NASA’s AROW Orion model via Ian Dees’s artemis‑viewer, with accurate solar‑array configurations.
- ▪A custom photo‑stepper extension synchronized image navigation with the 3D view and other panels on a shared timeline.
Hacker News (Front Page) files mainly under programming. We currently carry 633 of its stories. Top-voted stories on Hacker News.
Opening excerpt (first ~120 words) tap to expand
Visualizing the Artemis II Mission Orion's real trajectory, hundreds of mission photos, and a custom photo-stepper extension — all replayable on one Foxglove timeline Author: Nathan Johnson July 20, 2026 Share this post CommunityTutorialVisualization In April 2026, four astronauts flew around the Moon for the first time in over fifty years. Hank Green, a science communicator and YouTuber, built an awesome website to visualize the many photos taken on and around the spacecraft throughout the mission. I was inspired by Hank’s project (as I am by most of his projects and content), and as a recent addition to the Foxglove team, I saw a great opportunity to both learn our tool and explore the same dataset in a new way.
…
Excerpt limited to ~120 words for fair-use compliance. The full article is at Foxglove.
Discussion
0 commentsMore from Foxglove


